Own operations and commitment to environmental action
We are committed to environmental and climate protection, with the goal of keeping environmental impacts as low as possible. We therefore work to continuously improve our sustainability standards and the main environmental parameters in the most relevant areas.
RBI’s transition plan for own operations
RBI views environmental and climate protection as part of its responsibility to society, and sees itself as a fair partner to the environment. The direct environmental impacts of RBI’s operational activities are limited compared to those of production industries. Nevertheless, RBI has the goal of limiting negative environmental impacts at all of its sites.
The transition plan for emissions caused by RBI’s own operations follows the calculation methodology provided by the Science Based Targets initiative (SBTi) and is aligned with the 1.5°C requirement by the CSRD. RBI first set science-based targets in 2022, which were in line with the climate target of keeping global warming well below 2°C. To accommodate the rising ambition the targets for own operations were recalculated in 2024 using a methodology provided by the Science Based Targets initiative. The transition plan, including calculation pathway and targets, was acknowledged by the RBI Management Board.
In general, the environmental management system in Austria is based on international standards (ISO 14001). In general, energy efficiency, renewable energy and environmentally friendly mobility are particularly important in RBI’s own operations. In terms of its carbon footprint, energy consumption/building management, material consumption and mobility are the most important areas of action. These are also crucial with regard to achieving the climate targets.
Overview of KPIs
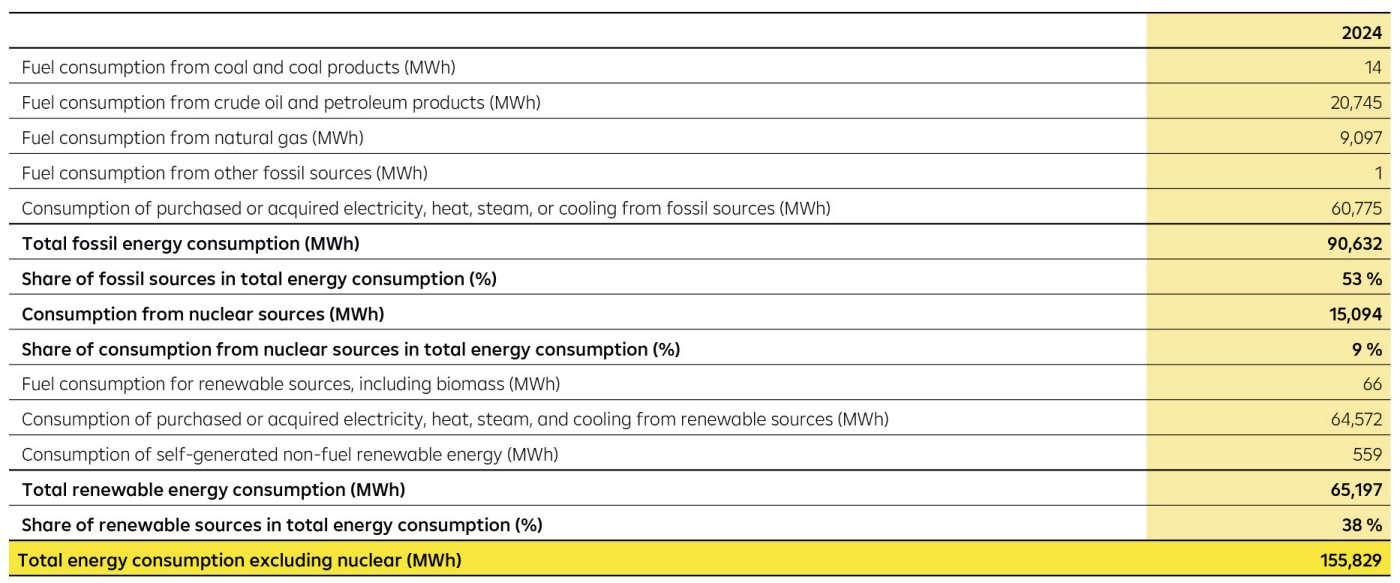
Energy consumption and mix
Due to the expansion of RBI’s consolidation scope for reporting in 2024, this year has been set as the new baseline for energy consumption. At 155,829 MWh, RBI’s energy consumption in 2024 contributed significantly to location-based emissions from own operations.

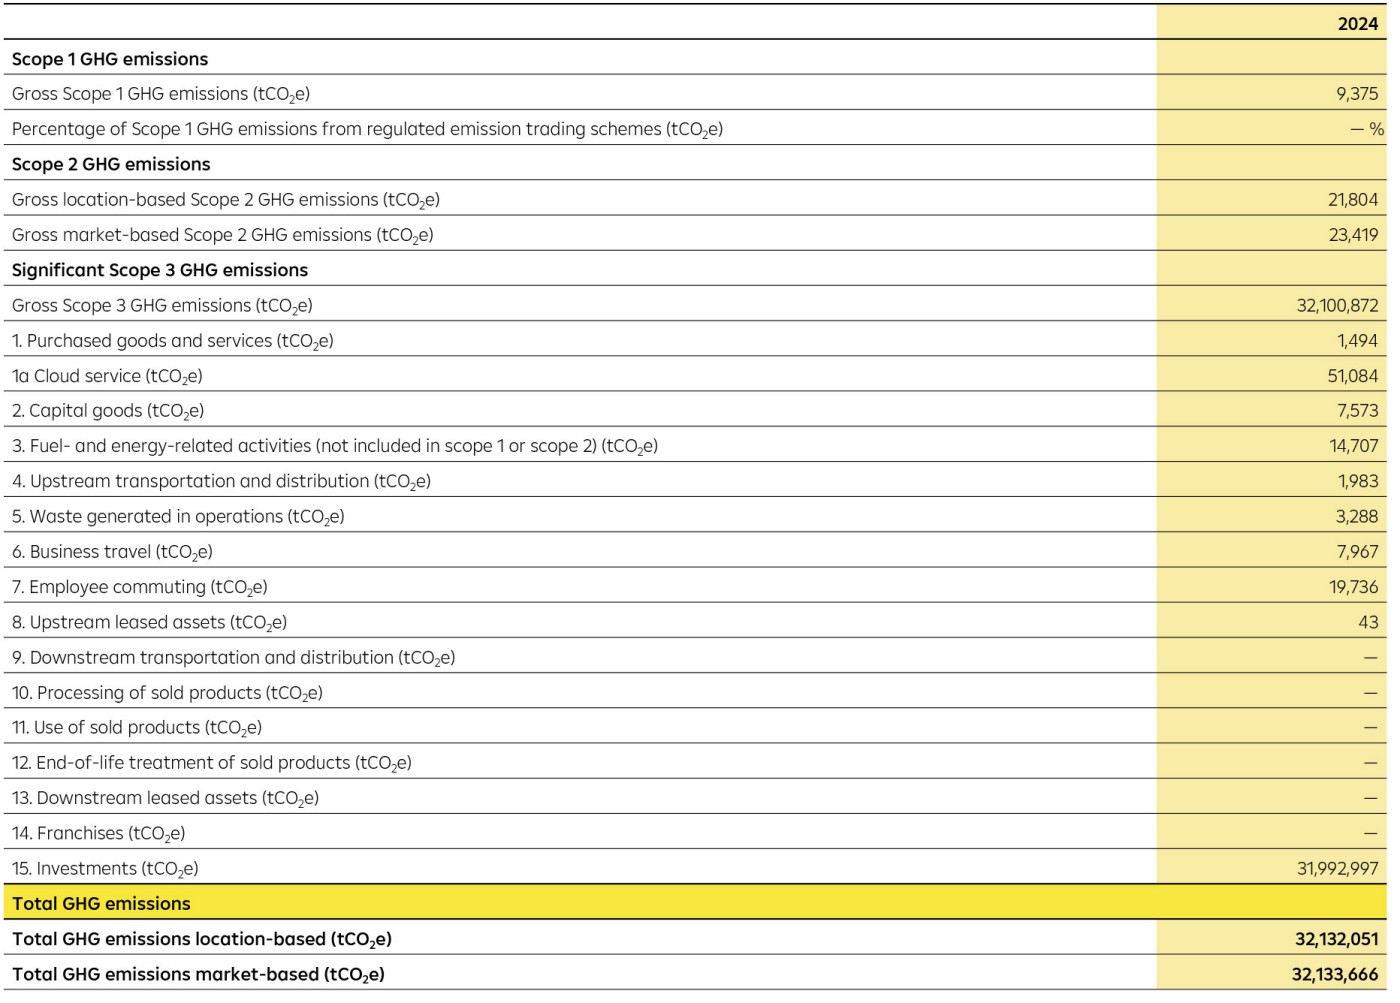
Total greenhouse gas emissions in detail
The data relating to own operations is collected for RBI, which includes the subsidiary banks in Central and Eastern Europe, head office and the material Austrian subsidiaries. In 2024, the consolidation scope had to be expanded in alignment with the CSRD and now includes further units. The following table includes greenhouse gas emissions from own operations in Scope 1, 2 and 3, as well as financed emissions under Scope 3-15.

Policies and targets
For the target setting, the SBTi absolute emissions reduction approach was chosen. It establishes a target to reduce absolute emissions by a specific percentage over a set timeline, aligning with the global carbon budget needed for a 1.5°C pathway. Reduction targets for own operations were set for scope 1 and 2 emissions to focus on the highest emission drivers. In line with this science-based approach, RBI has set the following targets:
Short-term (by 2025)
- Develop key elements of a transition plan for own operations to support the mid and long-term targets:
- Targeting the highest emission drivers of own operations (e.g. energy consumption)
- Individualized local strategies depending on specific conditions and markets
- Focusing on capacity building and learning from best practice within RBI
Mid-term (by 2030)
- Reduction of absolute scope 1 and 2 GHG emissions from own operations by 42 per cent from a 2024 base year.
- Ongoing adaption of the transition plan and linked measures.
Long-term (by 2050)
- RBI has committed to act in line with the 1,5 ºC pathway and aims to be in line with the net-zero greenhouse gas emission target by 2050.
The Environmental Policy is part of our sustainability agenda and forms the basis for our environmental management.